Why
A dashboard with twenty charts rarely explains anything. We started with the questions a team asks in a retro, and for each one built a section with 2–3 numbers and a list of the tasks behind them.
How it works
An overview of five questions
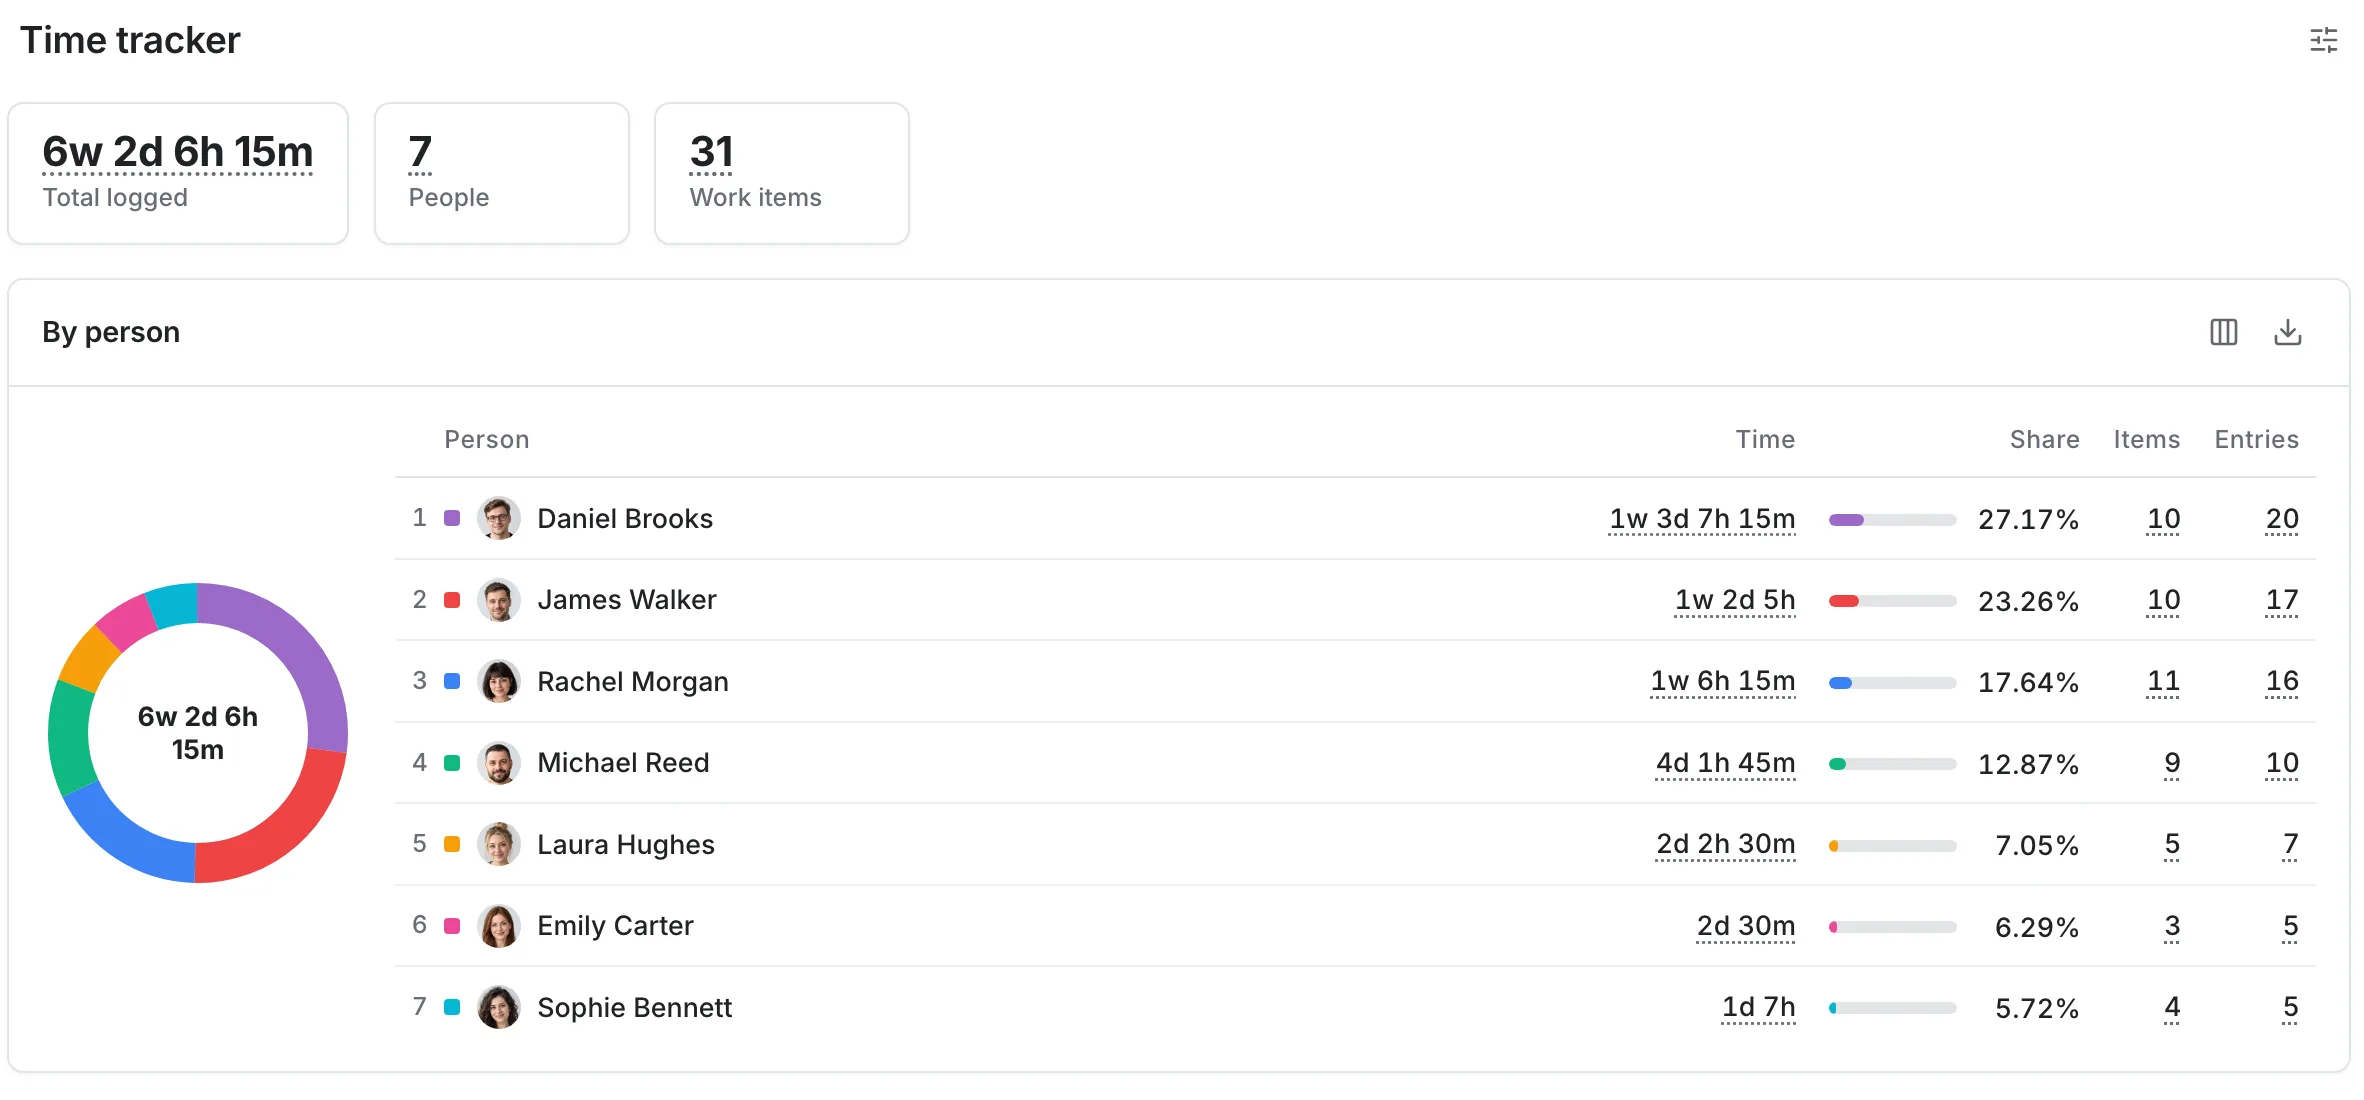
Flow, Returns, Time tracker, Composition, Sprints: each with its key numbers and a link into its own section.
Composition is a snapshot of “now”
Live tasks by type, status, assignee and priority. Archived, cancelled and deleted tasks are not counted; the period does not affect composition.
Time in statuses
A stay in a status counts if it ended within the chosen period. We count calendar time.
Time in statuses for the chosen period Stuck: from the moment of reaching the board
The clock starts when the task moved from the backlog to the board, not when it was created.
A return is not a re-plan
A return is a move backwards from review or from Done. Moving from “In progress” to “To do” is a re-plan, and it does not count as a return.
Task cycle
From entering the board to the last move into Done: the median, the 85th percentile, tasks above it and throughput.
Every number opens up
Clicking a number shows the tasks behind it, 50 at a time, with “Load more” and an export of the whole set to CSV or XLSX.
Good to know
- The view is remembered: hidden panels and columns stay hidden.
Availability
Annual Pro billing is 20% cheaper. Questions about plans: [email protected].